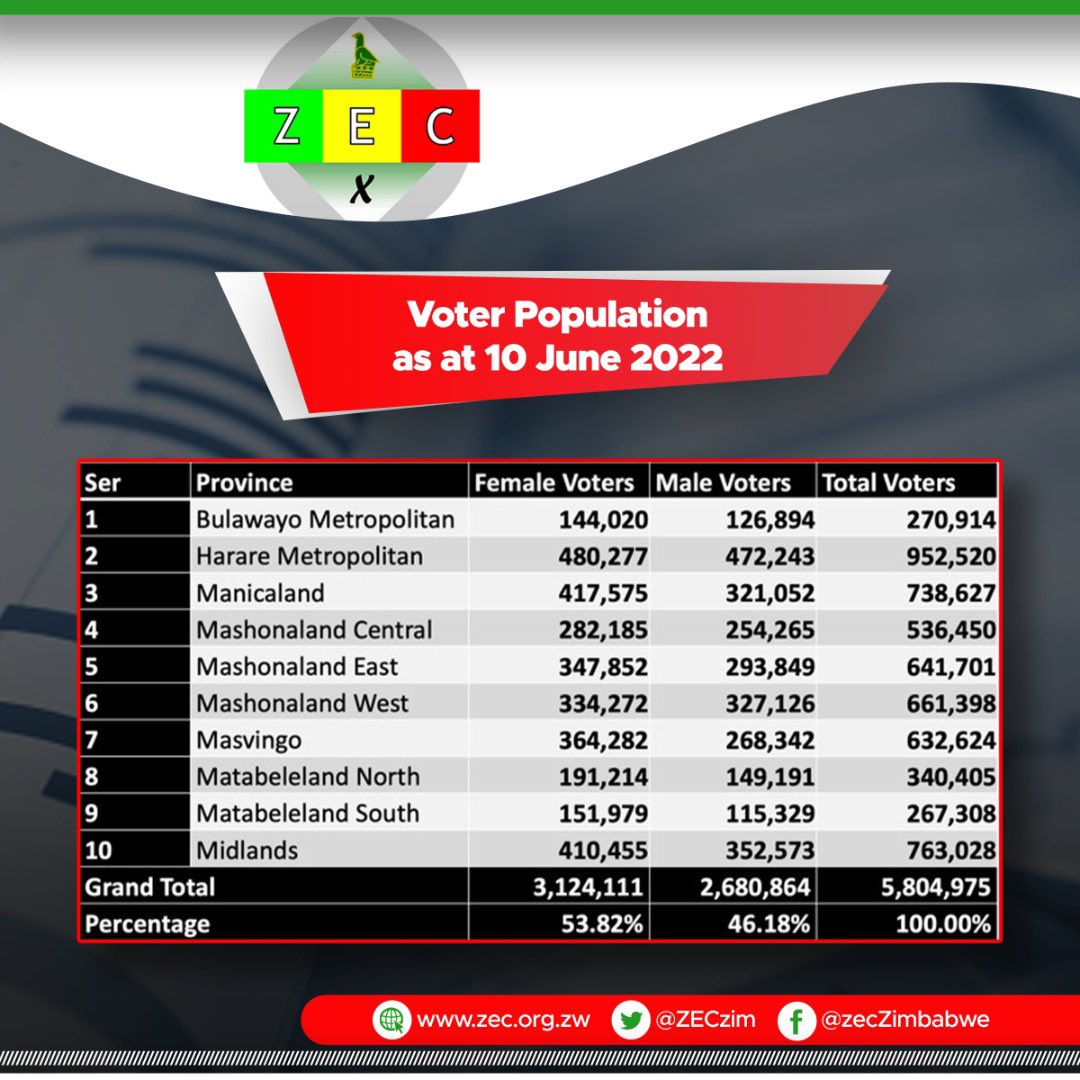
More than 5.8 million Zimbabweans had registered to vote as of 10 June 2022, an increase from 5.6 million in April, the Zimbabwe Electoral Commission (ZEC) has revealed.
According to the latest figures released by the electoral body, of the registered voters, 54 per cent are female while 46 per cent are male.
Harare had the highest number of voters at 952 520, followed by Midlands province, which had 763 028 voters.
Bulawayo and Matabeleland South provinces had the least number of voters with 270 914 and 267 308, respectively.
Here is the number of voters by province:
1 Bulawayo Metropolitan – (Female Voters: 144,020), (Male Voters: 126,894), (Total Voters: 270,914)
2 Harare Metropolitan – (Female Voters: 480,277), (Male Voters: 472,243), (Total Voters: 952,520)
3 Manicaland – (Female Voters: 417,575), (Male Voters: 321,052), (Total Voters: 738,627)
4 Mashonaland Central – (Female Voters: 282,185), (Male Voters: 254,265), (Total Voters: 536,450)
5 Mashonaland East – (Female Voters: 347,852), (Male Voters: 293,849), (Total Voters: 641,701)
6 Mashonaland West – (Female Voters: 334,272), (Male Voters: 327,126), (Total Voters: 661,398)
7 Masvingo – (Female Voters: 364,282), (Male Voters: 268,342), (Total Voters: 632,624)
8 Matabeleland North – (Female Voters: 191,214), (Male Voters: 149,191), (Total Voters: 340,405)
9 Matabeleland South – (Female Voters: 151,979), (Male Voters: 115,329), (Total Voters: 267,308)
10 Midlands (Female Voters: 410,455), (Male Voters: 352,573), (Total Voters: 763,028)
| Ser | Province | Female Voters | Male Voters | Total Voters |
| 1 | Bulawayo Metropolitan | 144,020 | 126,894 | 270,914 |
| 2 | Harare Metropolitan | 480,277 | 472,243 | 952,520 |
| 3 | Manicaland | 417,575 | 321,052 | 738,627 |
| 4 | Mashonaland Central | 282,185 | 254,265 | 536,450 |
| 5 | Mashonaland East | 347,852 | 293,849 | 641,701 |
| 6 | Mashonaland West | 334,272 | 327,126 | 661,398 |
| 7 | Masvingo | 364,282 | 268,342 | 632,624 |
| 8 | Matabeleland North | 191,214 | 149,191 | 340,405 |
| 9 | Matabeleland South | 151,979 | 115,329 | 267,308 |
| 10 | Midlands | 410,455 | 352,573 | 763,028 |
| Grand Total | 3,124,111 | 2,680,864 | 5,804,975 | |
| Percentage | 53.82% | 46.18% | 100.00% |


